Home and history
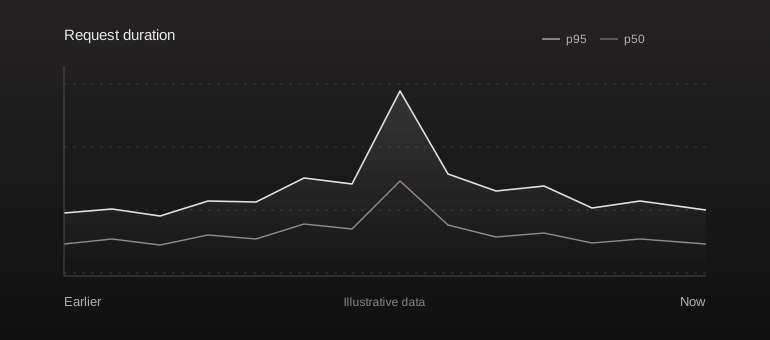
Read the project overview without confusing unknown data with healthy traffic.
Overview
Home combines received events, error occurrences, measured requests, sessions, users, performance, releases, and endpoints. Series come from available component/service identities; example labels in a preview are not a fixed list of services for every project.
Select a time period and environment before comparing counts. A graph can be empty because there is no matching telemetry, a capture feature is off, or the installation has not been verified.
Project panel
The project panel contains app information, repository and release context, active problems, Browser SDK controls, and tracking-domain configuration where available. Stack and app type describe the application; they do not prove that every runtime is instrumented.
History
History places recorded changes and releases next to runtime evidence. It depends on actual event and deployment records. Connecting GitHub does not reconstruct historical runtime events that were never captured.
Go deeper
Open a metric's detail view, endpoint, affected user, session, or incident to inspect the underlying evidence. Percentiles and rates reflect the captured sample and filters. Demonstration data in visual previews is not a production measurement.
See requests, users and sessions, and Activity.