Requests and endpoints
Inspect real traffic and optionally add a separate availability check.
Observe requests
The browser SDK records supported client HTTP requests. The Node SDK observes incoming HTTP traffic and supported outbound calls; request wrappers provide explicit route templates. Edge applications use withRequest.
import { init, withRequest, registerEndpoints } from '@everock/sdk/node';
init({ publicKey: process.env.EVEROCK_PUBLIC_KEY!, endpoint: process.env.EVEROCK_ENDPOINT! });
registerEndpoints([{ method: 'GET', path: '/products/:id', host: 'api.example.com' }]);
const getProduct = withRequest(async () => new Response('OK'), { route: '/products/:id' });
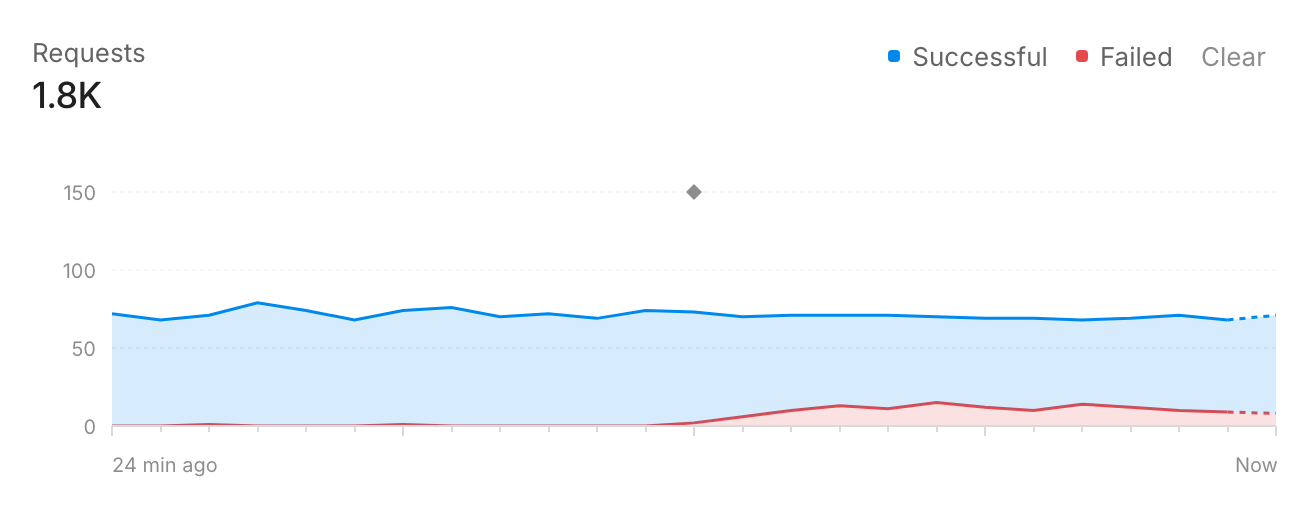
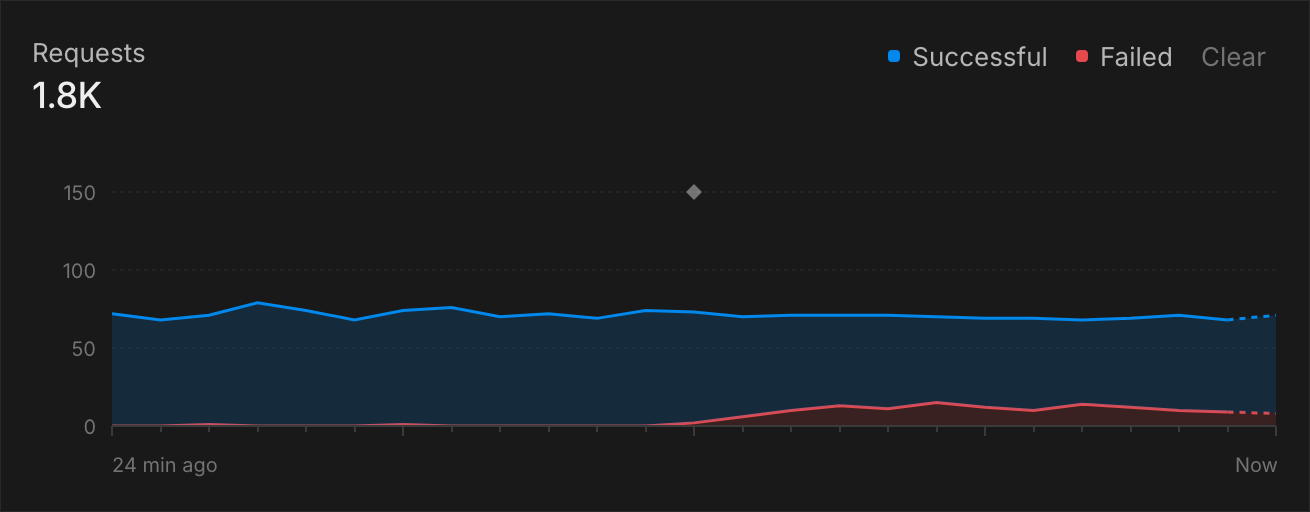
Home's endpoint list separates inbound and outbound traffic, method, host, path, environment, and component. Latency and failure rates describe captured requests, not every call that ever reached the server.
Interpret the status
- Observed traffic: health reflects recent measured requests.
- Declared, no traffic: the route is known, but there is insufficient runtime evidence.
- No recent evidence: absence of traffic does not prove uptime or an outage.
- Active monitor: scheduled checks provide an additional availability signal.
Add a monitor
From an endpoint's detail view, configure Set up monitor with a lightweight public health URL. Active checks are optional and can be disabled. The interval is configurable from 60 seconds to 24 hours.
Prefer a dedicated inexpensive GET /health or readiness endpoint. Do not point checks at paid scraping APIs, billable provider requests, destructive operations, or expensive business routes. Active checks make real HTTP requests to the configured destination.
Monitor thresholds separately control consecutive failures, recovery, and optional latency warnings. Disabling Inbox alerts is not the same as disabling scheduled requests.
See System services and webhooks.